 Carlos Muza / Unsplash
Businesses always need to come up with new and exciting ideas to keep up with a fast-paced society, whether it may be about coming up with a new marketing strategy for the company or providing presentations for meetings and seminars.
Fortunately, infographics can do all that. Learning more about infographics can open a big window of opportunities for your business. Venngage, a website known for making various visual presentations, can provide you with thousands of pre-generated infographic templates. If you are looking for a specific type of layout, Venngage has it.
Let us now explore and discuss some tips on how to effectively incorporate infographics into your business.
Why Use an Infographic?
Infographics are visual representations of complex data and information. It’s a summarization of a massive data compilation through visual context to make your report easy to digest and understandable.
This is most helpful and used in businesses. Using infographics can help you manage at least three areas in your company:
1. Marketing
Using business infographics increases the population’s awareness of your brand. It helps you in introducing your company to a global marketplace and tells them about your company’s history, objectives, and goals. It also lets you educate your audience about your products or services. You can use infographics for both digital and traditional marketing, spreading awareness about your brand through social media and printed flyers. It’s like hitting two birds with one stone.
2. Sales / Financial Reporting
Incorporating infographics in your sales or financial reports allows you to easily share and compare previous and recent figures. You can use charts and graphs to visually showcase the differences in your company’s sales within the last five years or display your proposed budget for a certain project.
3. Seminars
Companies are required to conduct yearly training and seminars for their employees’ continuous learning and growth. With that being said, an infographic is a great learning tool you can use for presentations and lectures. People are visual beings by nature; we absorb and learn things quicker with our eyes.
Effective Business Infographic Tips
Although it’s simple and easy, creating infographics can sometimes be tricky. To guide you, here are some helpful tips you can use.
1. Add more graphics.
Having lengthy explanations defeats the purpose of using infographics; they should be self-explanatory and simple. An infographic design should be focused more on the graphics and less on the text. This is the reason why infographics are easier to absorb and understand. An infographic with too much text will not get your information across your audience.
2. Do your research.
Business infographics should be honest and reliable. Conducting extensive research and providing accurate information and backing them up with reliable sources will increase your company’s integrity.
Remember, a factual infographic is an attractive infographic.
3. Spice up your title.
Catchy titles can either make or break your content. The title is the first thing that your readers notice and you only have one chance to nail it. It’s the most important marketing strategy you have. Catchy titles should be enticing, promising, or mysterious. To get their full attention, you need to reach their minds and create an itch that can only be scratched if they read more.
Tips for a Great Title
Speaking of titles, great titles are actually the best head turners. Come up with a creative title using these tips.
Be unique.
Create an outstanding title to separate you from the crowd. Yes, it’s hard to come up with new and unique ideas but you need to try. Set a time for brainstorming. Write everything you’ve thought of on a piece of paper to help you remember all your ideas and from there, you can mix and match everything to create a new and refreshing title.
Know the power of questions.
Using questions can trigger your audience. The eagerness of the human mind to provide an answer to a question is very hard to resist; use this to your advantage and come up with a nice and intriguing title.
Use emotions.
Engage your audience by using emotional adjectives. This also piques your customers’ interest, making them read and engage in your content.
The Importance of Looks
Making an infographic stand out is also crucial to hold your audience’s attention. Do that when you perfectly combine these two factors:
Colors
It’s important to understand that colors play an important role in infographics. Learn to mix up and limit your colors to at least three hues. That way, you won’t overcrowd your space, and important details will still be highlighted.
Font
Fonts are also as important as colors. They should be carefully picked and should not exceed three. Using too many fonts will make your output look more unprofessional and that is something we should prevent from happening.
Business Infographic Examples
Need inspiration? Here are a few infographic examples you can use for your business.
1. Timeline Infographic
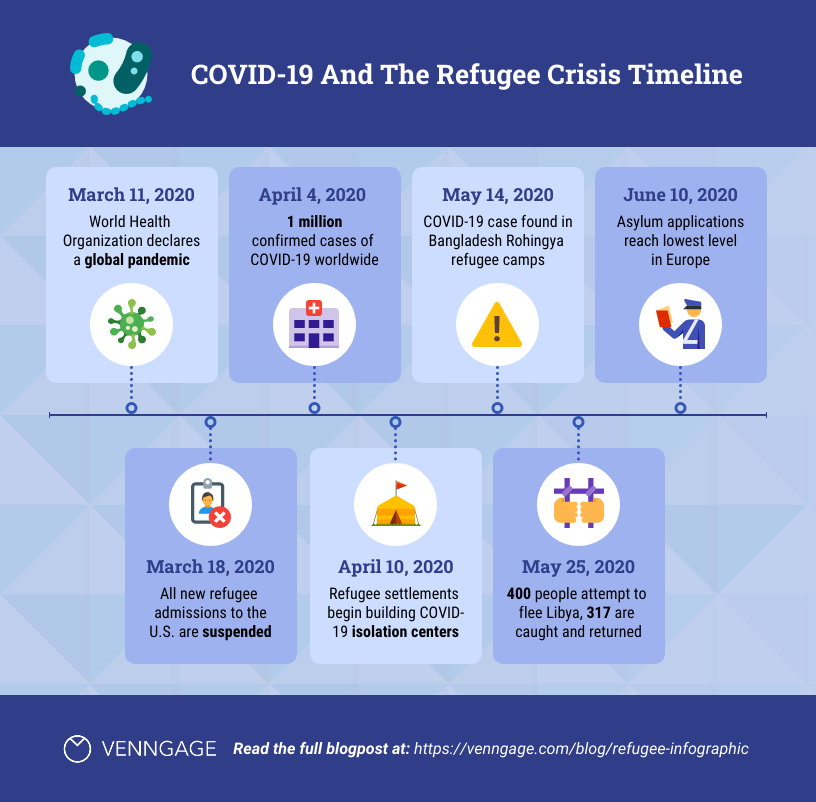
This type of infographic chronologically displays data. If you want your readers to learn about your company’s history, sum up activities/reports from the past months or years, or plan an upcoming project and event, this infographic suits you best.
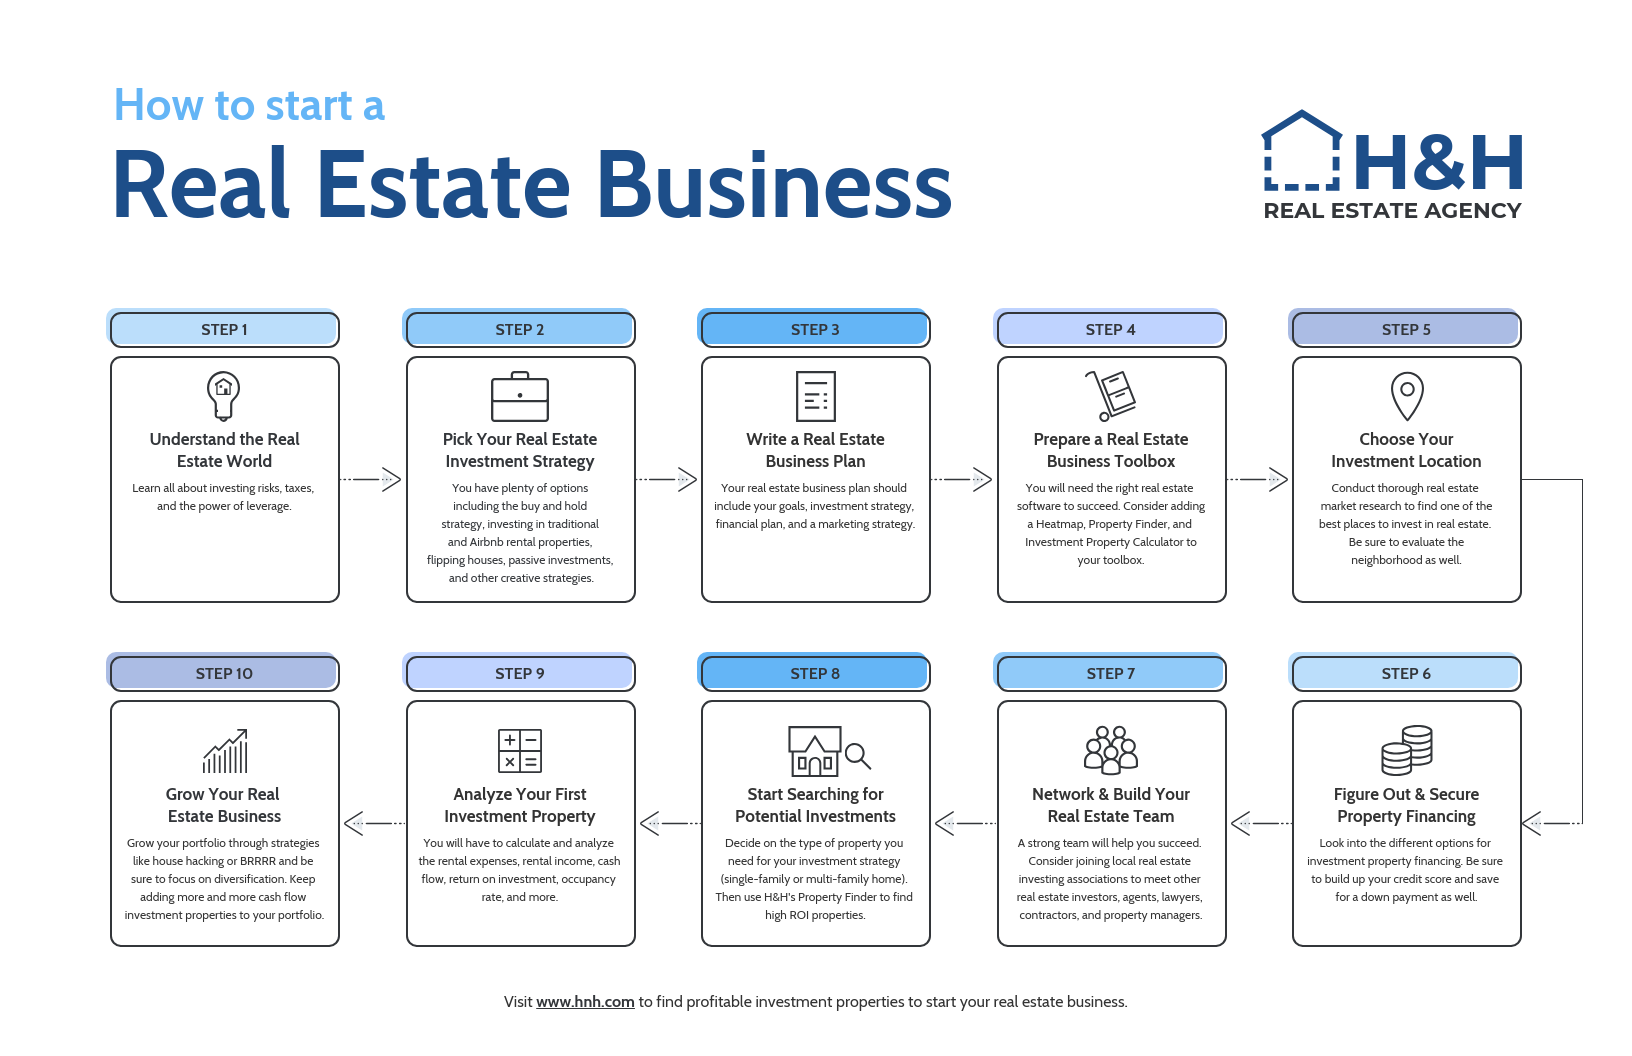
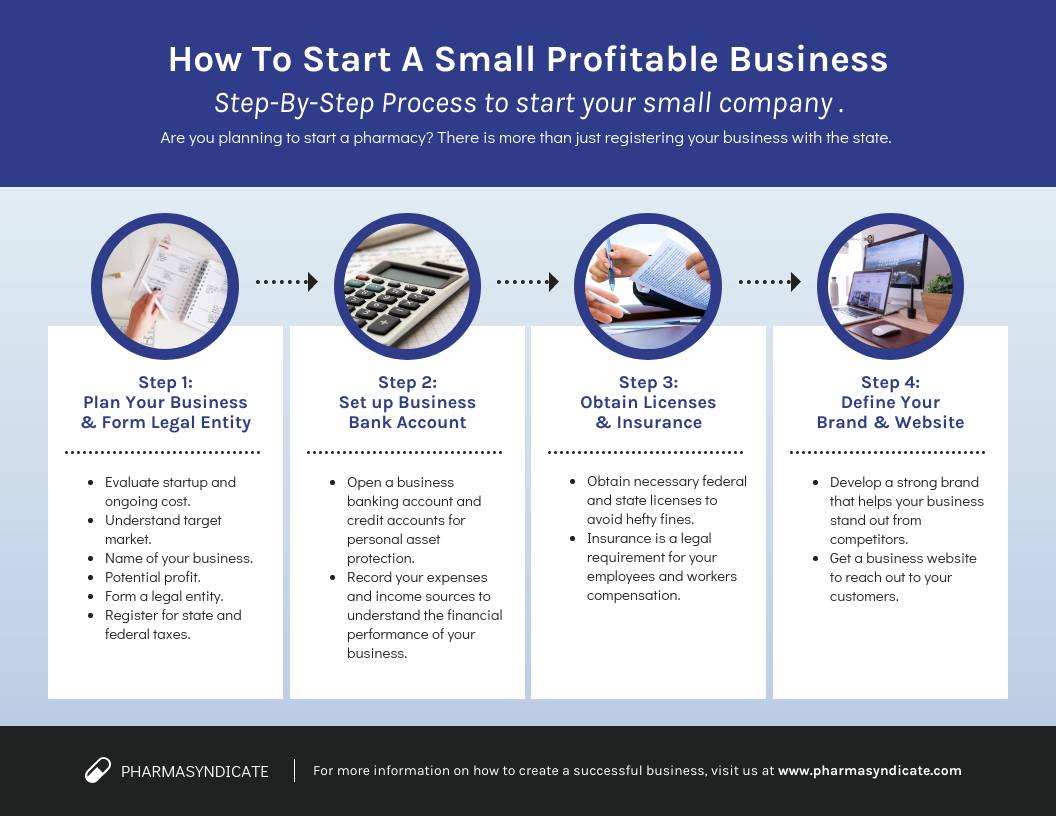
2. Informational Infographic
This type of visual presentation from Venngage is used for introducing a new subject or concept to your audience. This graphic is divided into sections with descriptive titles that provide knowledge and information.
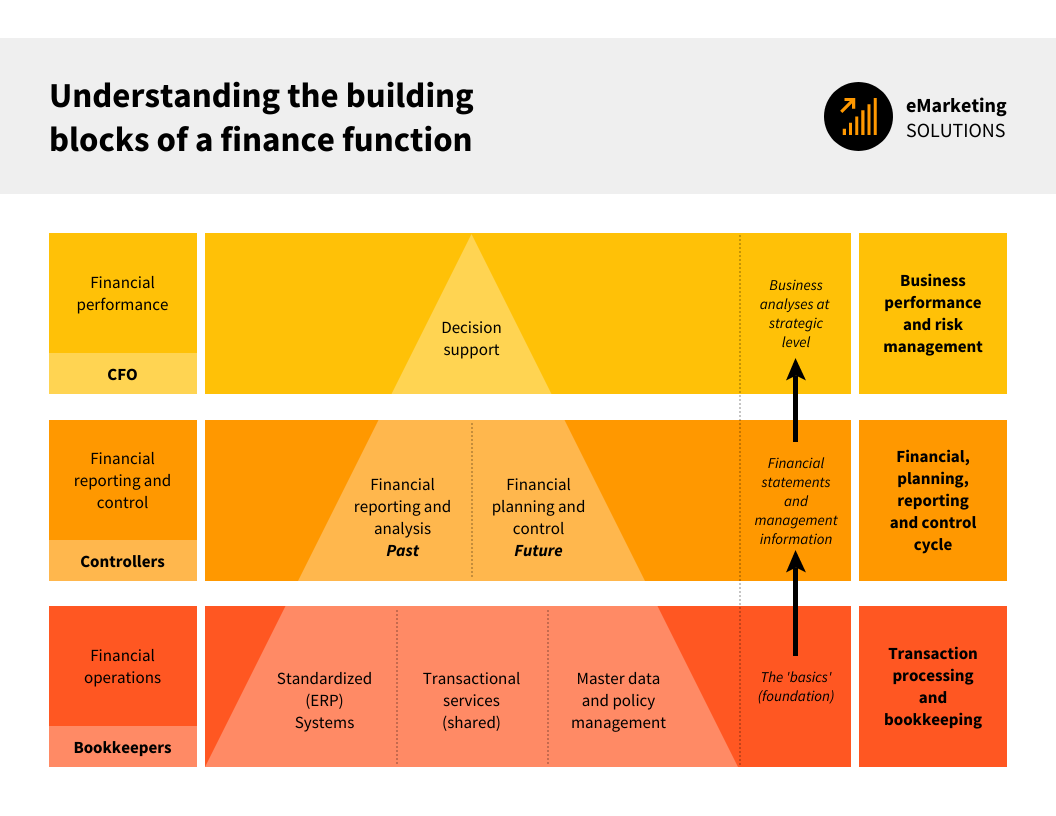
3. Statistical Infographic
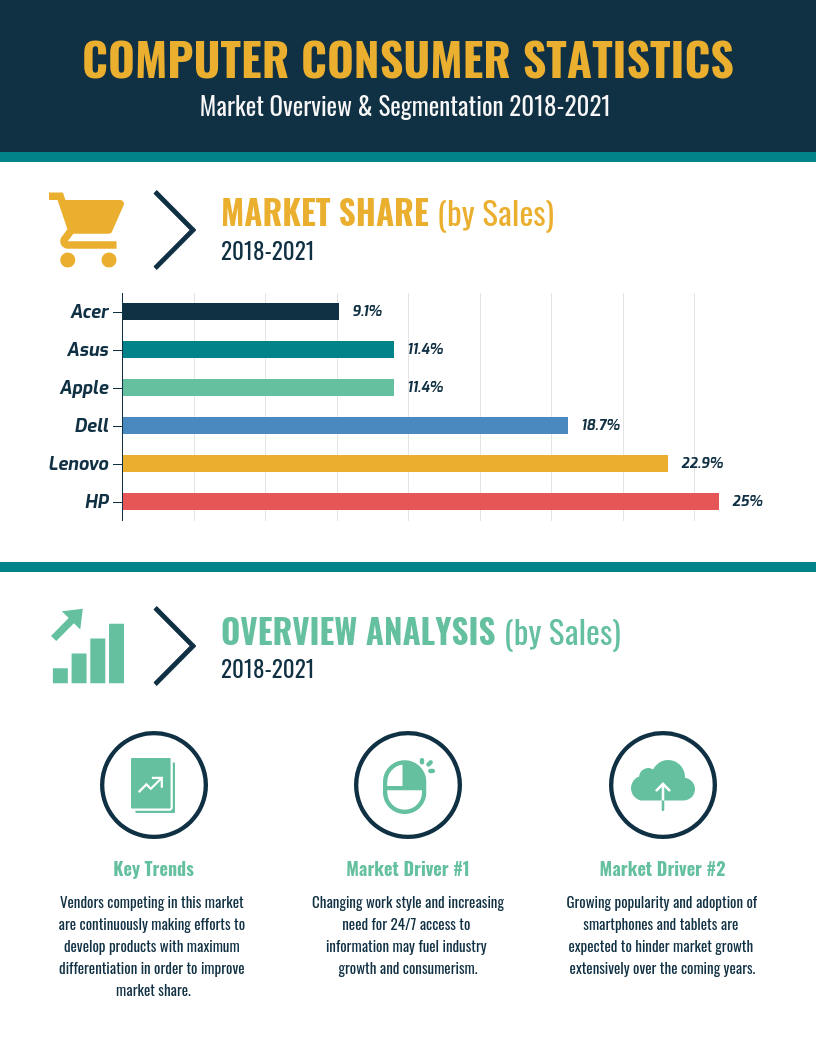
This graphic from Venngage templates focuses on using charts and graphs to showcase your data. This is best used to present survey results, represent research, and display demographic data.
Infographics are indeed a powerful tool you can use in many different ways. With these helpful and effective tips, you can now begin your adventure toward making your first business infographic. Good luck!